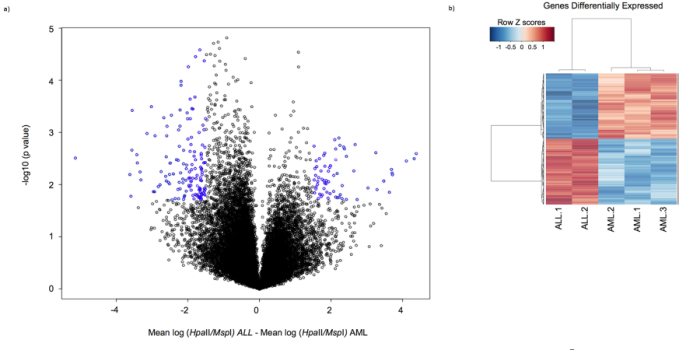
DNA methylation data can classify different types of cancer
Keywords
Flag Inappropriate
Delete Content
This image is linked to the following Scitable pages:

Identical twins often develop different characteristics, even though they carry the same sequence of DNA nucleotides. How can this be? The answer lies in epigenomics.


Comments
CloseComments
Please Post Your Comment