
Abstract
The challenge of developing an Android malware detection framework that can identify malware in real-world apps is difficult for academicians and researchers. The vulnerability lies in the permission model of Android. Therefore, it has attracted the attention of various researchers to develop an Android malware detection model using permission or a set of permissions. Academicians and researchers have used all extracted features in previous studies, resulting in overburdening while creating malware detection models. But, the effectiveness of the machine learning model depends on the relevant features, which help in reducing the value of misclassification errors and have excellent discriminative power. A feature selection framework is proposed in this research paper that helps in selecting the relevant features. In the first stage of the proposed framework, t-test, and univariate logistic regression are implemented on our collected feature data set to classify their capacity for detecting malware. Multivariate linear regression stepwise forward selection and correlation analysis are implemented in the second stage to evaluate the correctness of the features selected in the first stage. Furthermore, the resulting features are used as input in the development of malware detection models using three ensemble methods and a neural network with six different machine-learning algorithms. The developed models’ performance is compared using two performance parameters: F-measure and Accuracy. The experiment is performed by using half a million different Android apps. The empirical findings reveal that malware detection model developed using features selected by implementing proposed feature selection framework achieved higher detection rate as compared to the model developed using all extracted features data set. Further, when compared to previously developed frameworks or methodologies, the experimental results indicates that model developed in this study achieved an accuracy of 98.8%.
Introduction
Now-a-days, smartphones can do the same work as the computer has been doing. By the end of 2023, there will be around 6.64 billion smartphone users worldwide (https://www.bankmycell.com/blog/how-many-phones-are-in-the-world). According to the report (https://www.statista.com/statistics/272307/market-share-forecast-for-smartphone-operating-systems/) at the end of 2023, Android operating systems captured 86.2% of the total segment. The main reason for its popularity is that its code is written in open source which attracts developers to develop Android apps on a daily basis. In addition to that it provides many valuable services such as process management, security configuration, and many more. The free apps that are provided in its official store are the second factor in its popularity. By the end of March 2023 data (https://www.appbrain.com/stats/number-of-android-apps), Android will have 2.6 billion apps in Google play store.
Nonetheless, the fame of the Android operating system has led to enormous security challenges. On the daily basis, cyber-criminals invent new malware apps and inject them into the Google Play store (https://play.google.com/store?hl=en) and third-party app stores. By using these malware-infected apps cyber-criminals steal sensitive information from the user’s phone and use that information for their own benefits. Google has developed the Google Bouncer (https://krebsonsecurity.com/tag/google-bouncer/) and Google Play Protect (https://www.android.com/play-protect/) for Android to deal with this unwanted malware, but both have failed to find out malware-infected apps1,2,3. According to the report published by Kaspersky Security Network, 6,463,414 mobile malware had been detected at the end of 2022 (https://securelist.com/it-threat-evolution-in-q1-2022-mobile-statistics/106589/). Malware acts as a serious problem for the Android platform because it spreads through these apps. The challenging issue from the defender’s perspective is how to detect malware and enhance its performance. A traditional signature-based detection approach detects only the known malware whose definition is already known to it. Signature-based detection approaches are unable to detect unknown malware due to the limited amount of signatures present in its database. Hence, the solution is to develop a machine learning-based approach that dynamically learns the behavior of malware and helps humans in defending against malware attacks and enhancing mobile security.
Researchers and academicians have proposed different methods for analyzing and detecting malware from Android. Some of them have been proposed by using static analysis, for example, ANASTASIA4, DREBIN5, Droiddetector6 and DroidDet7. On the other side, some researchers have proposed with the help of dynamic analysis, for example, IntelliDroid8, DroidScribe9, StormDroid10 and MamaDroid11. But, the main constraints of these approaches are present in its implementation and time consumption because these models are developed with a number of features. On the other side, academicians and researchers3,12,13,14,15,16,17,18,19 also proposed malware detection frameworks that are developed by using relevant features. But, they have restrictions too. They implemented only already proposed feature selection techniques in their work.
So, in this research paper, to overcome the hindrances a feature selection framework is proposed. This helps in the evaluation of appropriate feature sets with the goal of removing redundant features and enhances the effectiveness of the machine-learning trained model. Further, by selecting a significant features a framework named PermDroid is developed. The proposed framework is based on the principle of artificial neural network with six different machine learning techniques, i.e., Gradient descent with momentum (GDM), Gradient descent method with adaptive learning rate (GDA), Levenberg Marquardt (LM), Quasi-Newton (NM), Gradient descent (GD), and Deep Neural Network (DNN). These machine learning algorithms are considered on the basis of their performance in the literature20. In addition to this, three different ensemble techniques with three dissimilar combination rules are proposed in this research work to develop an effective malware detection framework. F-measure and Accuracy have been considered as performance parameters to evaluate the performance. From the literature review21,22,23, it is noticed that a number of authors have concentrated on bettering the functioning of the malware detection models. However, their study had a key flaw, they only used a small amount of data to develop and test the model. In order to address this issue, this study report takes into account 500,000 unique Android apps from various categories.
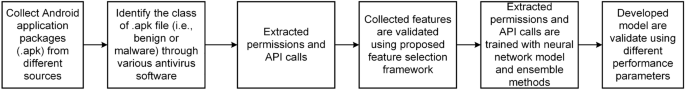
Steps are followed in developing Android malware detection framework.
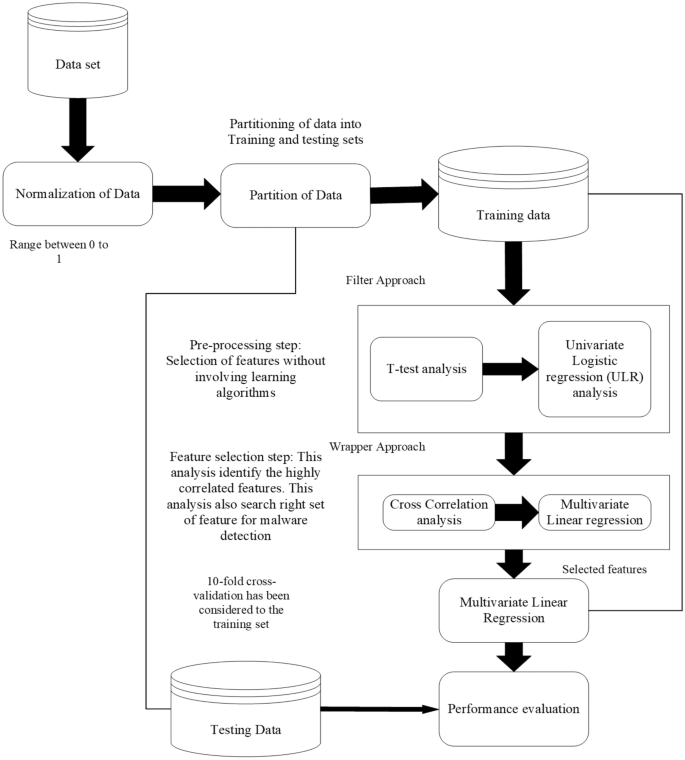
The method for developing a reliable malware detection model is represented in Fig. 1. The initial collection of Android application packages (.apk) comes from a variety of promised repositories (mentioned in “Creation of experimental data set and extraction of features” section). Anti-virus software is used to identify the class of .apk files at the next level (mentioned in “Creation of experimental data set and extraction of features” section). Then, features (such as API calls and permissions) are retrieved from the .apk file using various techniques described in the literature (mentioned in subsection 3.4). Additionally, a feature selection framework is applied to evaluate the extracted features (discussed in “Proposed feature selection validation method” section). Then, a model is developed using an artificial neural network using six different machine-learning techniques and three different ensemble models, employing the selected feature sets as input. Finally, F-measure and Accuracy are taken into consideration while evaluating the developed models. The following are the novel and distinctive contributions of this paper:
-
In this study, to develop efficient malware detection model half a million unique apps have been collected from different resources. Further, unique features are extracted by performing dynamic analysis in this study.
-
The methodology presented in this paper, is based on feature selection methodologies, which contributes in determining the significant features that are utilized to develop malware detection models.
-
In this study, we proposed three different ensemble techniques that are based on the principle of a heterogeneous approach.
-
Six different machine learning algorithms that are based on the principle of Artificial Neural Network (ANN) are trained by using relevant features.
-
When compared to previously developed frameworks and different anti-virus software in the market, the proposed Android malware detection framework can detect malware-infected apps in less time.
-
A cost-benefit analysis shows that the proposed Android malware detection framework is more effective in identifying malware-infected apps from the real world.
The remaining sections of this research paper are arranged as follows: “Related work” section presents the literature survey on Android malware detection as well as the creation of research questions. “Research methodology” section gives an overview of the research methodology used to create the Android malware detection framework. Different machine learning and ensemble techniques are addressed in “Machine learning technique” section. The proposed feature selection validation technique is discussed in “Proposed feature selection validation method” section. The experimental results are presented in “Experimental setup and results” section. Threats to validity are presented in “Threats to validity” section. Conclusion and the future scope are discussed in “Conclusion and future work” section.
Related work
The exploitation of the vulnerability is common these days to acquire higher privilege on Android platforms. Since 2008, cybercriminals have started targeting Android devices. An exploit app, from the perspective of Android security, can assist cyber-criminals in bypassing security mechanisms and gaining more access to users’ devices. Cybercriminals may exploit user data by selling their personal information for monetary gain if they took advantage of these privileges. The detection process, which has been used by researchers in the past and is based on Artificial Neural Networks (ANN) and feature selection techniques, is addressed in this subsection.
Androguard (https://code.google.com/archive/p/androguard/) is a static analysis tool that detects malware on Android devices using the signature concept. Only malware that is already known to be present and whose definition is in the Androguard database is identified. It cannot, however, identify unidentified malware. Andromaly23, is developed on a dynamic analysis tool that uses a machine learning technique. It monitored CPU utilization, data transfer, the number of effective processes, and battery usage in real-time. The test was carried out on a few different types of simulated malware samples, but not on the applications that are present in the real-world. By using the semantics of the code in the form of code graphs collected from Android apps, Badhani et al.24 developed malware detection methodology. Faruki et al.21 introduced AndroSimilar, which is based on the principles of generated signatures that are developed from the extracted features, which are used to develop malware detection model.
Aurasium25 takes control of an app’s execution by examining arbitrary security rules in real-time. It repackages Android apps with security policy codes and informs users of any privacy breaches. Aurasium has the problem of not being able to detect malicious behavior if an app’s signature changes. They performed dynamic analysis of Android apps and considered call-centric as a feature. The authors tested their method on over 2900 Android malware samples and found that it is effective at detecting malware activity. A web-based malware evaluation method has been proposed by Andrubis26, it operates on the premise that users can submit apps via a web service, and after examining their activity, it returns information on whether the app is benign or malicious. Ikram et al.27 suggested an approach named as DaDiDroid based on weighted directed graphs of API calls to detect malware-infected apps. The experiment was carried out with 43,262 benign and 20,431 malware-infected apps, achieving a 91% accuracy rate. Shen et al.28 developed an Android malware detection technique based on the information flow analysis principle. They implement N-gram analysis to determine common and unique behavioral patterns present in the complex flow. The experiment was carried out on 8,598 different Android apps with an accuracy of 82.0 percent. Yang et al.29 proposed an approach named EnMobile that is based on the principle of entity characterization of the behavior of the Android app. The experiment was carried out on 6,614 different Android apps, and the empirical results show that their proposed approach outperformed four state-of-the-art approaches, namely Drebin, Apposcopy, AppContext, and MUDFLOW, in terms of recall and precision.
CrowDroid34, which is built using a behavior-based malware detection method, comprises of two components: a remote server and a crowdsourcing app that must both be installed on users’ mobile devices. CrowDroid uses a crowdsourcing app to send behavioral data to a remote server in the form of a log file. Further, they implemented 2-mean clustering approach to identify that the app belongs to malicious or benign class. But, the crowDroid app constantly depletes the device’s resources. Yuan et al.52 proposed a machine learning approach named Droid-Sec that used 200 extracted static and dynamic features for developing the Android malware detection model. The empirical result suggests that the model built by using the deep learning technique achieved a 96% accuracy rate. TaintDroid30 tracks privacy-sensitive data leakage in Android apps from third-party developers. Every time any sensitive data leaves the smartphone, TaintDroid records the label of the data, the app that linked with the data, as well as the data’s destination address.
Zhang et al.53 proposed a malware detection technique based on the weighted contextual API dependency graph principle. An experiment was performed on 13500 benign samples and 2200 malware samples and achieved an acceptable false-positive rate of 5.15% for a vetting purpose.
AndroTaint54 works on the principle of dynamic analysis. The features extracted were used to classify the Android app as dangerous, harmful, benign, or aggressive using a novel unsupervised and supervised anomaly detection method. Researchers have used numerous classification methods in the past, like Random forest55, J4855, Simple logistic55, Naïve Bayes55, Support Vector Machine56,57, K-star55, Decision tree23, Logistic regression23 and k-means23 to identify Android malware with a better percentage of accuracy. DroidDetector6, Droid-Sec52, and Deep4MalDroid58 work on the convention of deep learning for identifying Android malware. Table 1 summarizes some of the existing malware detection frameworks for Android.
The artificial neural network (ANN) technique is used to identify malware on Android devices
Nix and Zhang59 developed a deep learning algorithm by using a convolution neural network (CNN) and used API calls as a feature. They utilized the principle of Long Short-Term Memory (LSTM) and joined knowledge from its sequences. McLaughlin et al.60, implemented deep learning by using CNN and considered raw opcode as a feature to identify malware from real-world Android apps. Recently, researchers6,58 used network parameters to identify malware-infected apps. Nauman et al.61, implemented connected, recurrent, and convolutional neural networks, and they also implemented DBN (Deep Belief Networks) to identify malware-infected apps from Android. Xiao et al.62, presented a technique that was based on the back-propagation of the neural networks on Markov chains and considered the system calls as a feature. They consider the system call sequence as a homogenous stationary Markov chain and employed a neural network to detect malware-infected apps. Martinelli et al.63, implemented a deep learning algorithm using CNN and consider the system call as a feature. They performed an experiment on a collection of 7100 real-world Android apps and identify that 3000 apps belong to distinct malware families. Xiao et al.64, suggested an approach that depends on the principle of LSTM (Long Short-Term Memory) and considers the system call sequence as a feature. They trained two LSTM models by the system call sequences for both the benign and malware apps and then compute the similarity score. Dimjas̈evic et al.65, evaluate several techniques for detecting malware apps at the repository level. The techniques worked on the tracking of system calls at the time the app is running in a sandbox environment. They performed an experiment on 12,000 apps and able to identify 96% malware-infected apps.
Using feature selection approaches, to detect Android malware
Table 2 shows the literature review for malware detection done by implementing feature selection techniques. Mas’ud et al.66 proposed a functional solution to detect malware from the smartphone and can address the limitation of the environment of the mobile device. They implemented chi-square and information gain as feature selection techniques to select the best features from the extracted dataset. Further, with the help of selected best features, they employed K-Nearest Neighbour (KNN), Naïve Bayes (NB), Decision Tree (J48), Random Forest (RF), and Multi-Layer Perceptron (MLP) techniques to identify malware-infected apps. Mahindru and Sangal3 developed a framework that works on the basis of feature selection approaches and used distinct semi-supervised, unsupervised, supervised, and ensemble techniques parallelly and identify 98.8% malware-infected apps. Yerima et al.67 suggested an effective technique to detect malware from smartphones. They implemented mutual information as a feature selection approach to select the best features from the collected code and app characteristics that indicate the malicious activities of the app. To detect malware apps, from the wild, they trained selected features by using Bayesian classification and achieved an accuracy of 92.1%. Mahindru and Sangal15 suggested a framework named as “PerbDroid” that is build by considering feature selection approaches and deep learning as a machine classifier. 2,00,000 Android apps in total were subjected to tests, with a detection rate of 97.8%. Andromaly23 worked on the principle of the Host-based Malware Detection System that monitors features related to memory, hardware, and power events. After selecting the best features by implementing feature selection techniques, they employed distinct classification algorithms such as decision tree (J48), K-Means, Bayesian network, Histogram or Logistic Regression, Naïve Bayes (NB) to detect malware-infected apps. Authors14 suggested a malware detection model based on semi-supervised machine learning approaches. They examined the proposed method on over 200,000 Android apps and found it to be 97.8% accurate. Narudin et al.68 proposed a malware detection approach by considering network traffic as a feature. Further, they applied random forest, multi-layer perceptron, K-Nearest Neighbor (KNN), J48, and Bayes network machine learning classifiers out of which the K-Nearest Neighbor classifier attained an 84.57% true-positive rate for detection of the latest Android malware. Wang et al.69 employed three different feature ranking techniques, i.e., t-test, mutual information, and correlation coefficient on 3,10,926, benign, and 4,868 malware apps using permission and detect 74.03% unknown malware. Previous researchers implement feature ranking approaches to select significant sets of features only. Authors13 developed a framework named as “DeepDroid” based on deep learning algorithm. They use six different feature ranking algorithms on the extracted features dataset to select significant features. The tests involved 20,000 malware-infected apps and 100,000 benign ones. The detection rate of a framework proposed using Principal component analysis (PCA) was 94%. Researchers and Academicians70,71,72,73 also implemented features selection techniques in the literature in different fields to select significant features for developing the models.
Research questions
To identify malware-infected apps and considering the gaps that are present in the literature following research questions are addressed in this research work:
-
RQ1 Does the filtering approach helps to identify that whether an app is a benign or malware-infected (first phase of the proposed feature selection framework)? To determine the statistical significance among malicious and benign apps, the t-test is used. After, determining significant features, a binary ULR investigation is applied to select more appropriate features. For analysis, all the thirty different feature data sets are assigned (shown in Table 5) as null hypotheses.
-
RQ2 Do already existing and presented work’s sets of features show an immense correlation with each other? To answer this question, both positive and negative correlations are examined to analyze the sets of features, which help in improving the detection rate.
-
RQ3 Can the identified features assist in determining whether the app is malware-infected or not? The primary objective of this question is to use the feature selection framework validation approach to determine the appropriate features. In this paper, four stages (i.e., ULR, t-test, Correlation analysis, and multivariate linear regression stepwise forward selection) are implemented to identify the appropriate features, that helps in identifying whether an app contains malicious behavior or not.
-
RQ4 Which classification algorithm among the implemented machine learning algorithms is most appropriate for identifying malware-infected apps? To answer to this question the efficiency of various machine learning approaches are evaluated. In this study, three different ensemble approaches and six different machine learning algorithms based on neural networks are considered.
-
RQ5 Is the feature collected (such as an app’s rating, API calls, permissions, and the number of people who have downloaded the app) sufficient for identifying a malicious app or not? This question helps in determining whether or not considering features can detect malware-infected apps in the real world. To answer this question, the performance of our suggested model is compared with previously published frameworks as well as several anti-virus scanners in the market.
Research methodology
Based on the research questions mentioned above, the methodology that is used in this research paper is mentioned in the following subsections. In order to improve the detection rate for malware, the obtained data set has been normalized, and dependent and independent variables have been selected.
Independent variables
In this study, the model is developed by applying the proposed feature selection approach, which helps in the detection of malware-infected apps. Additionally, as shown in Fig. 2, five different strategies to select the best features are used. The best features are selected from other accessible features created on intermediate explore models at each level.
Dependent variables
The focus of this research is to find a link between Android apps and the features (such as app rating, API calls, permission, and the number of users who have downloaded an app) retrieved from the collected data set. The malware app characteristics are separated from the benign app features in the dependent variable of Android apps.
Creation of experimental data set and extraction of features
In this research paper, 70,000 .apk files from Google play store (https://play.google.com/store?hl=en), and more than 3 lacs .apk files from third-party app store i.e., Softonic (https://en.softonic.com/android), Android Authority (https://www.androidauthority.com/apps/), CNET (https://download.cnet.com/android/) belong to
Proposed framework for feature selection and its validation.
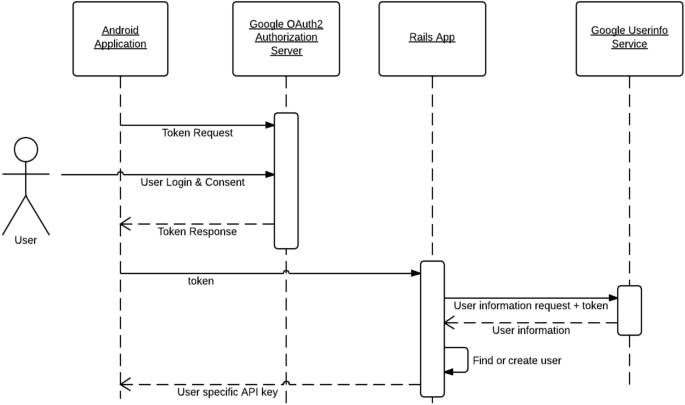
Sequence diagram showing reservation using Android app.
benign group and 70,000 malware-infected Android apps from79,80,81 and Sanddroid (http://sanddroid.xjtu.edu.cn:8080/) belongs to malicious group are collected to develop an effective malware detection framework. As seen in Table 3, the .apk files we collected fall under thirty different categories. Collected malware-infected apps belong to ten different malware categories: AD (Adware), BA (Backdoor), HT (Hacker Tool), RA (Ransom), TR (Trojan), TB (Trojan-Banker), TC (Trojan-Clicker), TD (Trojan-Dropper), TS (Trojan-SMS) and TSY (Trojan-Spy). Classes are identified by using two distinct scanners i.e., VirusTotal (https://www.virustotal.com/gui/) and Microsoft Windows Defender (https://windows-defender.en.softonic.com/download) and on the basis of its behavior defined in the study82.
To formulate an efficient malware detection framework, we extract 310 API calls and 1419 unique permissions (https://github.com/ArvindMahindru66/Computer-and-security-dataset), by implementing the procedure mentioned in the literature3,13,15,83 . If an app requests the permission and API call during installation or runtime, we mark it as “1”; otherwise, we mark it as “0”. The following are some of the features of a certain app that have been extracted:
0,1,1,1,1,0,0,0,0,0,1,1,1,1,1,1,1,1,1,1,1,1,1,1,1,1,
0,0,0,0,0,0,0,0,0,0,1,1,1,1,1,1,1,1,1,1,1,1,1,0,0,0,
1,1,1,1,1,1,1,1,1,1,1,1,1,1,1,1,1,1,1,1,1,1,1,1,1,1,
1,1,1,1,1,1,1,1,1,1,0,0,0,0,0,0,0,0,0,0,0,0,0,0,0,0, and so on.
After extracting API calls and permissions from the collected data set from .apk files, it is divided into thirty different features data sets (Mahindru, Arvind (2024), “Android Benign and Malware Dataset”, Mendeley Data, V1, doi: 10.17632/rvjptkrc34.1). Table 4 illustrates the creation of various feature data sets as well as their explanations. These extracted features are divided into different sets on the basis of its behavior to which it belongs3,13,15,83. The main reasons to divide these extracted features into thirty different feature data sets are: to select significant features by using the proposed feature selection framework and to remove the complexity.
Figure 3 demonstrate the sequence diagram of an Android app by showing the example of an railway reservation app. How the process is started and how it is interact with other APIs and the permissions that are running in the background (Table 5).
Machine learning technique
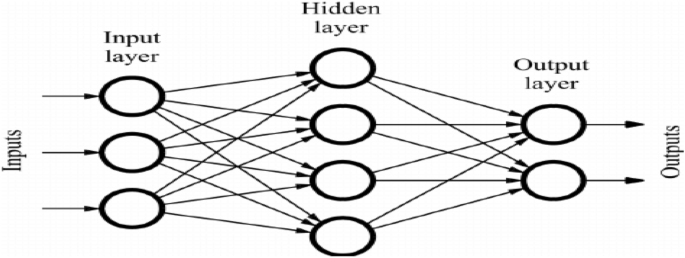
ANN stands for artificial neural networks, and it is a computing system based on biological neural networks. These are able to perform certain tasks by utilizing certain examples, without using task-specific rules. Researchers are implementing ANN to solve different problems in malware detection, pattern recognition, classification, optimization, and associative memory84. In this paper, ANN is implemented to create a malware detection model. The structure of the ANN model is shown in Fig. 4. ANN contains input nodes, hidden nodes, and output nodes.
Artificial neural network.
The input layer employs a linear stimulation function, while the hidden and output layers employ squashed-S or sigmoidal functions. ANN can be presented as:
where B is the input vector, A is the weight vector and \(O^{'}\) denotes the desired output vector. In order to minimize the mean square error (MSE), the value of A is updated in each step. Mean square error can be calculated from the equation below:
Here, O is the actual output value, and \(O^{'}\) is the desired output value. Various methods were proposed by researchers20,84 to train the neural network. In this research work, six different kinds of machine learning algorithms (namely, Gradient Descent approach, Quasi-Newton approach, Gradient Descent with Momentum approach, Levenber-Marquardt approach, Gradient Descent with Adaptive learning rate approach, and Deep neural network) are considered to develop malware detection model. These models are effective in the field of software fault prediction20, intrusion detection and desktop malware predictions85 too.
Gradient descent with momentum approach
This approach accelerates the rate of convergence dramatically20,84. To obtain new weights, this approach combines the fraction diversity20,84,86. X is the updated weighed vector defined as:
where A denotes the momentum parameter value, \(X_k\) is the current weight vector and \(X_{k+1}\) is the update value of the weight vector and \((E_k)\), used to identify the lower value in error space. Here, \(X_{k+1}\) relys on both the weight and the gradient. To determine the optimal value of A we implemented the cross-validation technique.
Gradient descent approach
This approach updates the weights to reduce the output error20,84,86. In Gradient descent (GD) approach, to identify the lower value in error space \((E_k)\), the \(1^{st}\) - order derivative of the total error function is computed by considering, the following equation:
Redundancy weight vector X is modified by employing gradient vector G20,84,86. The up-dation of X is done through the following formula
where \(G_n\) is the gradient vector, \(O_{x+1}\) is the revised weight vector and \(\alpha\) is the gaining constant. To calculate the optimum value of \(\alpha\), we implement cross-validation approach.
Gradient descent method with adaptive learning rate approach
In the GD approach, during training, the learning rate \((\alpha )\) remains stable. This approach is based on the concept that is quite perceptive to the approximation value of the learning rate. At the time of training, if the value of the learning rate is too high, the build model can be highly unstable and oscillate its value20. On the reverse of this, if the training value is too small, the procedure may take a long way to converge. Practically, it is not easy to find out the optimal value of \(\alpha\) before training. Actually, during the training process, the value of \(\alpha\) changes20. In each iteration, if the performance decline along with the required aim, the \(\alpha\) value is added by 1.05, and in reverse of this, if the performance increase by more than the factor of 1.04, then the \(\alpha\) value is incremented by 0.720.
Levenberg Marquardt (LM) approach
The foundation of LM is an iterative technique that helps in locating the multivariate function’s minimal value. At the time of training, this value can be calculated as the sum of squares of real-valued with non-linera functions which helps in modifying the weights20,87. This method is quite stable and fast because it combines the Gauss Newton and the steepest descent approach. The iterative process for the same is given by
where \(X_{k+1}\) is the updated weight, \(X_k\) is the current weight, I is the identity matrix, \(\mu >0\) is named as combination coefficient and J is the Jacobian matrix. For a small value of \(\mu ,\) it becomes Gauss-Newton approach and for large, \(\mu ,\) it acts as GD approach. Representation of Jacobian matrix is : \(J=\) \(\begin{bmatrix} \frac{\partial E_{1,1}}{\partial X_1}&{} \frac{\partial E_{1,1}}{\partial X_2}&{}\cdots &{}\frac{\partial E_{1,1}}{\partial X_N}\\ \frac{\partial E_{1,2}}{\partial X_1}&{} \frac{\partial E_{1,2}}{\partial X_2}&{}\cdots &{}\frac{\partial E_{1,2}}{\partial X_N}\\ \vdots &{}\vdots &{}\vdots &{}\vdots \\ \frac{\partial E_{P,M}}{\partial X_1}&{} \frac{\partial E_{P,M}}{\partial X_2}&{}\cdots &{}\frac{\partial E_{P,M}}{\partial X_N}\\ \end{bmatrix}\) where P, N and M is the input patterns, weights and the output patterns.
Quasi-Newton approach
In order to compute the total error function, this approach requires the evaluation of the second order derivatives for each component of the gradient vector20,84. The iterative scheme for the Weight vector X is given as:
where \(X_k\) and \(X_{k+1}\) are the current and updated weight vectors, accordingly. H is the Hessian matrix given by \(H=\) \(\begin{bmatrix} \frac{\partial ^2E}{\partial X_1^2}&{} \frac{\partial ^2E}{\partial X_1X_2}&{}\cdots &{}\frac{\partial ^2E}{\partial X_1X_N}\\ \frac{\partial ^2E}{\partial X_1X_2}&{} \frac{\partial ^2E}{\partial X_2^2}&{}\cdots &{}\frac{\partial ^2E}{\partial X_2X_N}\\ \vdots &{}\vdots &{}\vdots &{}\vdots \\ \frac{\partial ^2E}{\partial X_1X_N}&{} \frac{\partial ^2E}{\partial X_2X_N}&{}\cdots &{}\frac{\partial ^2E}{\partial X_N^2} \end{bmatrix}\)
Deep learning neural network (DNN) approach
Convolutional Neural Networks (CNN) and Deep Belief Networks (DBN) are two deep architectures88 that can be combined to create DNN. In this article, the DBN architecture to build our deep learning approach is implemented. The architecture of the deep learning method is demonstrated in Fig. 5. The procedure is separated into two stages: supervised back-propagation and unsupervised pre-training. Restricted Boltzmann Machines (RBM) with a deep neural network is used to train the model with 100 epoches in the early stages of development. An iterative method is implemented to construct the model with unlabeled Android apps in the training step. Pre-trained DBN is fine-tuned with labeled Android apps in a supervised manner during the back-propagation step. In both stages of the training process, a model developed using deep learning methods uses an Android app.
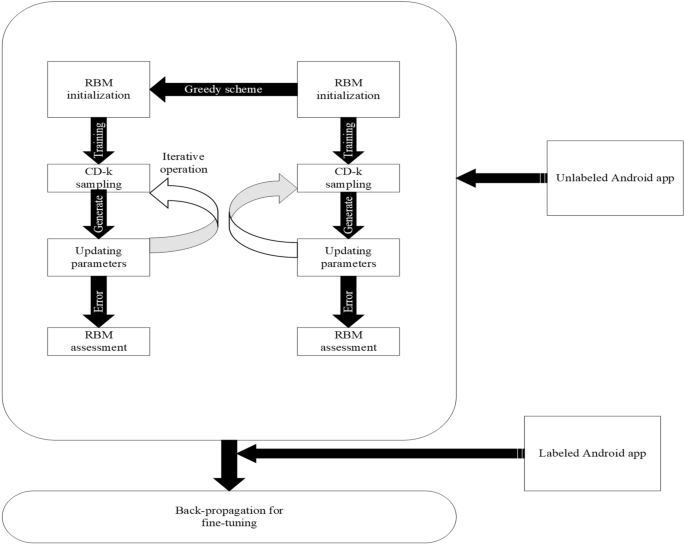
Deep learning neural network (DNN) method constructed with DBN.
Ensembles of classification models
In this study, three different ensemble models to detect malware from Android apps is also proposed. During development of the model, the outputs of all the classification models have been considered where the base machine learning algorithm allocated several priority levels and output is calculated by applying some combination rules. Ensemble approaches are divided into two types:
-
Homogenous ensemble approach: In this approach, all classification models, are of the same kinds, but the difference is in generating the training set.
-
Heterogenous ensemble approach: Here, all base classification approaches are of distinct types.
On the basis of combination rules, ensemble approaches are divided into two distinct categories:
-
Linear ensemble approach: While developing the model, with a linear ensemble approach an arbitrator combines the results that come from the base learners, i.e., selection of classification approach, average weighted, etc.
-
Nonlinear ensemble approach: While developing the model, with the nonlinear ensemble approach, it fed the result of the base classifier, which is a nonlinear malware detection model for example Decision tree (DT), Neural network (NN), etc.
In this work, a heterogenous ensemble approach having three distinct combination rules is adapted. The ensemble techniques are detailed in Table 6.
BTE (best training ensemble) approach
The BTE technique is based on the observation that each classifier performs differently when the data set is partitioned20. Among the applied classifier, the best model is selected to train data set that are founded on the principles of certain performance parameters. In this research paper, accuracy is considered as a performance parameter. Algorithm 1 given below is considered to calculate the ensemble output \(E_{result}\).
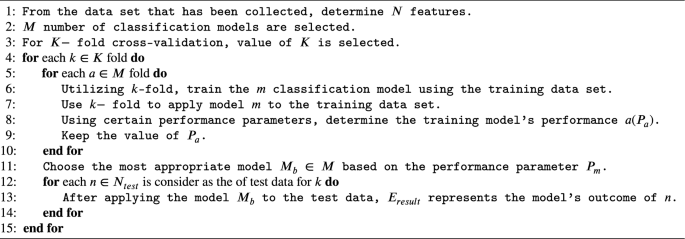
Best Training Ensemble (BTE) approach.
MVE (majority voting ensemble) approach
MVE approach, based on the principle to consider the output of the test data for each classifier, and the ensemble output \((E_{result})\) is concerned with the majority group differentiated by the base classifier20. Ensemble output \((E_{result})\) is calculated by implementing Algorithm 2.
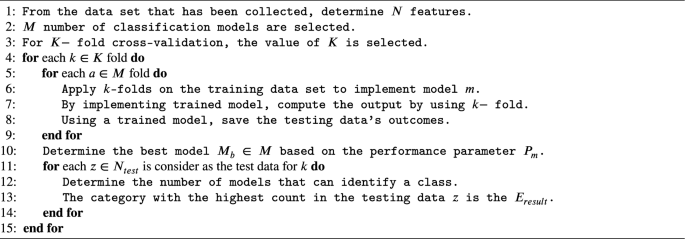
Majority Voting Ensemble (MVE) Approach.
NDTF (nonlinear ensemble decision tree forest) approach
In this study, to train the model with base leaner, is also considered. Further, the trained model is implemented the results on the corresponding testing data set to make the model for the final detection of malware apps. In this research paper, Decision tree forest (DTF) has been considered as a non-linear ensemble as a classifier which was suggested by Breiman in 2001. The developed model is based on the outcome of the collected results of the distinct decision trees. Algorithms 3 is used to calculate the result \((E_{result})\).
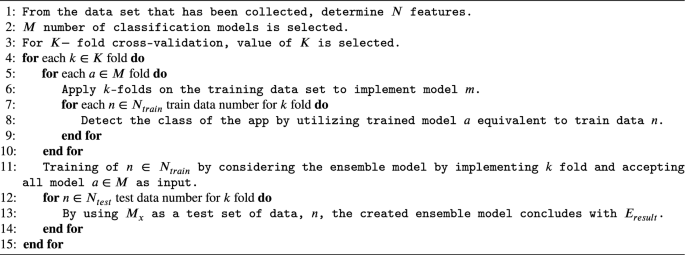
Nonlinear Ensemble Decision Tree Forest (NDTF) Approach.
Method for normalizing the data
In order to comply with the required diversity of input properties and prevent the saturation of the neurons, it is important to normalize the data prior to deploying a neural network spanning the range of 0 to 189. The Min-max normalizing approach is used in this research study. This technique is work on the principle of a linear transformation, which brings each data point \(D_{q_i}\) of feature Q to a normalized value \(D_{q_i},\) that lies in between \(0-1.\)
To obtain the normalized value of \(D_{q_i}:\), use the following equation:
The relative values of the relevance of the characteristic Q are min(Q) and max(Q).
Parameters considered for evaluation
This section provides definitions for the performance metrics needed to identify malicious apps. The confusion matrix is used to determine all of these characteristics. Actual and detected classification information is included in the confusion matrix, which was created using a detection approach. The constructed confusion matrix is shown in Table 7. F-measure and accuracy are two performance parameters that are used to evaluate the performance of malware detection algorithms in this research. Formulas for evaluating the accuracy and F-measure are given below:
-
False positive (FP) A false positive occurs when the developed model identifies the positive class incorrectly.
-
False negative (FN) When the developed model successfully identifies the negative class, a false negative occurs.
-
True negative (TN) An accurate identification of the negative class by the developed model represents a true negative conclusion.
-
True positives (TP) An accurate identification of the positive class by the developed model represents a real positive conclusion.
-
Recall The data set’s positive classes that are made up of all other positive classes are identified.
$$\begin{aligned} Recall =\frac{x}{x + z}, \end{aligned}$$(9)where \(x= N_{Malware\rightarrow Malware},\) \(z= N_{Malware\rightarrow Benign}\)
-
Precision The accuracy measures the proportion of forecasts in the positive class that are indeed in the positive class.
$$\begin{aligned} Precision =\frac{x}{x + y}. \end{aligned}$$(10)where \(y= N_{Benign\rightarrow Malware}\)
Accuracy Accuracy is measured as3:
where \({N_{classes} = x+y+z+w}\),
\(w= N_{Benign\rightarrow Benign}\)
F-measure F-measure is measured as3:
Proposed feature selection validation method
The selection of relevant feature sets is an important challenge for data processing in various machine learning and data mining applications90,91,92. In the field of Android malware detection, a number of authors13,14,15,69,93,94 applied only limited feature subset selection and feature ranking approaches i.e., Correlation, Goodman Kruskals, Information Gain, Chi-squared, Mutual Information, and t-test methods to detect malware. The first limitation of the previous studies is that they used a small data set (i.e., the number of malware or benign apps is less in number) to validate the proposed techniques. The additional significant disadvantage of the feature selection lies in the fact that after selecting the best features no comparison analyses were made among the classifiers model developed by reduced sets of features and by using all extracted feature sets. Mainly, the main reason for this is that the vast collection of features found in particular categories of the app (like books, entertainment, comics, game, etc.) makes it complex to produce a classifier by examining all the features as input. It is the best of our knowledge, that academicians and researchers were implemented these feature selection approaches individually; but no one selected features by combining all of these feature selection approaches. However, a framework for the feature selection approach has been given in this study, which helps in selecting the most appropriate features and enhance the effectiveness of the malware detection model. The suggested framework is applied to apps that have been gathered from the various repositories listed in section 2.4 and that fall under the thirty categories listed in Table 3. Finally, we verified the framework by comparing the effectiveness of the models developed after implementing feature selection method with the efficiency of ones constructed using the whole data set initially formed.
Figure 2 demonstrates the phases of the proposed feature selection validation framework. Without using machine learning algorithms, this framework aims to determine whether the selected features are useful in detecting malicious apps. The wrapper strategy is used to pick the sets of features that are useful in identifying malware apps after all crucial components have been examined. It keeps track of the progress of the learning algorithm that was used to identify each feature subset. In this work, the selected features are investigated using linear discriminant analysis (LDA).
-
i.
Data set Table 3 summarized the data set used in this research work. The considered data set belongs to 141 different malware families.
-
ii.
Normalization of data By using the Min-max normalizing approach, all features are normalized between the ranges of 0 and 1.
-
iii.
Partition of data We examined at the data set that wasn’t used for training in order to evaluate the proposed feature selection approach. Further, the data set is divided into two different parts one part is used for training, and the remaining is used for testing. The group ratios in the training and testing of the data sets are nearly identical.
-
iv.
Filter approach Pre-processing is the term that describes this technique because it eliminates extraneous features. In this step, the t-test and ULR analysis are implemented.
-
a.
t-test analysis It examine the statistical significance of benign and malware apps using the t-test method. In a 2-class problem (malware apps and benign apps), analysis of the null hypothesis (H0) significant that the two populations are not equal, or it is seen that there is a noticeable variance among their mean values and features used by both of them are different95. Furthermore, it shows that the features affect the malware detection result. Hence, those features are considered, which have significant differences in their mean values, and others are excluded. Hence, it is essential to approve the null hypothesis (i.e., H0) and discard the alternative ones95. t-test is implemented on each of the attributes and then P value for each feature is calculated, which indicates how well it distinguishes the group of apps. According to research by95, features with an P value of < 0.05 show significant biases.
-
b.
Univariate logistic regression (ULR) analysis After identifying features that make a significant difference between malware and benign apps, binary ULR analysis is implemented to test the correlation among features that helps in malware detection95. ULR analysis is implemented on each selected feature set, which helps in discovering whether the above-selected features were essential to detect the malware-infected apps or not. Only those features are considered, which are having P value < 0.05. From the results of the ULR analysis and t-test, the hypothesis are rejected and accepted mentioned in Table 5.
-
a.
-
v.
Wrapper approach To determine optimum sets of the feature, cross-correlation analysis and multivariate linear regression stepwise forward selection is implemented in this stage.
-
a.
Cross correlation analysis After finding the important features, the correlation analysis is implemented and then examination for both negative and positive correlation coefficients (i.e., r-value) between features is performed. If a feature has a value of r > = 0.7 or r-value < =0.7 with other features, i.e., have a higher correlation then the performance of these features is studied separately. Further, those features are selected, which perform better.
-
b.
Multivariate linear regression stepwise forward selection It is not imply that, features that are achieved are relevant to develop malware detection framework. In this stage, ten-fold cross-validation technique is applied to determine the significant features.
-
a.
-
vi.
Performance evaluation Further, to validate that proposed framework is able to identify malware-infected apps that were developed by implementing the steps mentioned above by using independent test data. Additionally, the efficiency of the essential feature sets used for malware detection is validated. On thirty different categories of Android apps, nine different machine learning classifiers were used to develop the investigation model. To evaluate the framework two separate performance parameters, are considered i.e., F-measure and Accuracy. The effectiveness of our detection model is then evaluated using the proposed malware detection methodology.
Evaluation of proposed framework
Three different approaches are used to evaluate our proposed framework:
-
a.
Comparison with previously used classifiers Parameters like Accuracy and F-measure are compared with existing classifiers proposed by researchers in the literature to see if our suggested model is feasible or not.
-
b.
Comparison with AV scanners To compare the effectiveness of our suggested work, ten different anti-virus scanners are considered and their performance is evaluated on the collected data set.
-
c.
Detection of unknown and known malware families The proposed framework is also examined to see whether it can identify known and unknown malware families.
Experimental setup and results
The experimental setting used to develop the malware detection model is described in this portion of the paper. The model is developed using a Neural Network (NN) using six different types of machine learning algorithms, namely GD, NM, LM, GDA, GDM, DNN, and three ensemble techniques, including the best training, non-linear decision tree forest, and majority voting. These algorithms are applied on Android apps that were collected from different resources. Each category has a distinct number of benign and malicious apps (they are further separated into various families), which is sufficient for our analysis. Figure 6 presents PermDroid, our suggested framework.
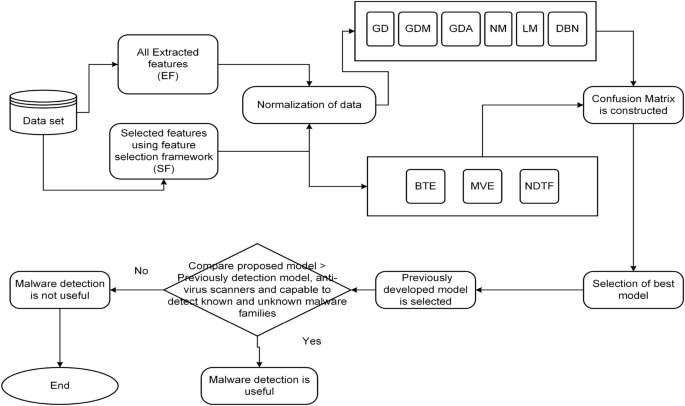
Proposed framework i.e., PermDroid.
Following are the phases that are pursued in this study, to develop an effective and efficient malware detection framework. The proposed feature selection framework is applied to all the extracted feature data sets, to select significant features. After that, six different machine learning algorithms based on the principle of neural network and three different ensemble algorithms are considered to develop a malware detection model. So, in this study, a total of 540 (30 different Android apps data sets * 9 different machine learning techniques * (one takes into account all extracted features, and another takes into account features identified using the suggested feature selection framework. )) different detection models are developed. The following are a detailed description of the model followed in this study:
-
1.
Thirty different extracted feature data sets are used to implement the proposed feature selection framework.
-
2.
The first stage, which involved identifying significant features, was employed as an input to train the model using various classification and ensemble machine learning approaches. In this research paper, ten-fold cross-validation technique is implemented to verify the develop model16. Further, outliers are eliminated, which effect the performance of the proposed framework. The performance of outliers is measured using the equation below:
$$\begin{aligned} e_i=\left\{ \begin{array}{ll} \text{ if } |z_{ji}-\hat{z_j}|>3 * \sigma \text{ for } \text{ Effective } \text{ outliers, } \\ \text{ if } |z_{ji}-\hat{z_j}|\le 3 * \sigma \text{ for } \text{ Non } \text{ Effective } \text{ outliers } \end{array}\right. \end{aligned}$$(13) -
3.
The developed model using the aforementioned two processes is evaluated using the collected data set in order to determine whether or not the proposed framework is successful in identifying malicious apps.
Validation of the proposed feature selection framework
In this subsection, the selection of significant feature sets for malware detection is explained. Our analysis is started by using thirty different feature sets (mentioned in Table 4).
t-Test analysis
t-test analysis is used to determine the statistical significance of detecting the malware from Android apps. In this work, t-test is applied on extracted feature sets and calculated its P value. Further, in this study, the cut-off P value considered is 0.05, i.e., it denotes that feature sets that have P value < 0.05 has a strong prediction capability. Figure 7 illustrates the findings of a t-test performed on the thirty various categories of Android apps that comprise up our obtained data set. The P value is provided using two forms for simplicity of use (box with black circle \((\cdot)\) means P value < 0.05 and blank box \({}_ \Box\) means P value > than 0.05). The sets of features with emphasis P values of < 0.05 have a significant impact on identifying malicious or benign apps. Figure 7 shows how the S29, S27, S25, S23, S22, S21, S19, S18, S13, S10, S8, S5, S3, and S1 feature sets might help to detect malicious and benign apps in the Arcade and Action categories. As a result, in this study, we rule out the hypotheses H1, H3, H5, H8, H10, H13, H18, H19, H21, H22, H23, H25, H27, and H29, coming to the conclusion that these sets of features are capable of identifying apps in the Arcade and Action category that are malicious or benign.

t-Test analysis.

Error box-plots for all the set of permissions in Arcade and Action category apps.
To understand the relationship between malware and benign apps, we have drawn an error box-plot diagram. These box-plot diagrams verify the outcomes of the t-test analysis. If there is no overlapping in means and their confidence intervals (CI), then it means there will be a statistical difference between malware and benign apps else. There is no significant difference between them. An error box-plot of the 95% confidence intervals throughout the sets of features and the mean for Arcade and Action category apps is demonstrated in Fig. 8. The outcomes of other categories of Android apps are of similar types. Based on Fig. 8, we can observe that the boxes of S29, S27, S25, S23, S22, S21, S19, S18, S13, S10, S8, S5, S3, and S1 sets of feature do not overlap which means they are significantly different from each other. The mean value of the malware group is higher than the benign group apps. Based on error box-plots, we consider the hypotheses H1, H3, H5, H8, H10, H13, H18, H19, H21, H22, H23, H25, H27 and H29 concluding that these feature sets can able to identify the malware-infected apps for Arcade and Action category Android apps.
ULR analysis
To examine whether the selected sets of feature after implementing t-test analysis are significant to identify malware apps or not, in this study, ULR analysis is performed on selected sets of features. A set of features is considerably associated with malware detection if its P value is < 0.05. In every task, some sets of features are essential for the evolution of the malware detection model, while different sets of features do not seem to be appropriate for malware detection. The outcomes of the ULR approach are demonstrated in Fig. 9. Equivalent to t-test analysis, the same representation is used as such in P values, i.e., blank box means P value > 0.05 and box having black square has P value \(\le\) to 0.05.

ULR analysis.
From Fig. 9, it is clear that among thirty different categories of features, only S5, S3, S1, S13, S10, S23, S19, S29, and S25 sets of features are significant detectors of malware apps. As a result, we reject null hypotheses H1, H3, H5, H10, H13, H19, H23, H25, and H29 and conclude that these sets of features are directly related to the functioning of the apps. After implementing t-test and ULR analysis on our collected sets of features, rejection and acceptance of the hypotheses is done that is presented in the Table 5. Figure 10 demonstrates the rejection and acceptance of the hypotheses for all of the thirty different categories of Android apps. The horizontal and vertical axes indicate the name of the hypothesis and the equivalent category of the Android app, accordingly. To represent the rejection and acceptance of the hypotheses, the cross symbol \((\times )\) and black circle \((\cdot )\), are used respectively. Based on Fig. 10, it is observed that only sixteen hypotheses out of thirty are accepted. Others are rejected for Arcade and Action category Android apps.

Hypothesis.
Cross correlation analysis
Figure 11 demonstrates the Pearson’s correlation between sets of features for all the categories of Android apps. The lower triangular (LT) and upper triangular (UT) matrices indicate the correlation in different sets of features for distinct Android app categories. The linear relation is evaluated by using the value of the correlation coefficient between distinct sets of extracted features from Android apps. In the present paper, Pearson’s correlation (r: Coefficient of correlation) is used to determine the linear relationship among distinct sets of features. The direction of the association is determined by whether the correlation coefficient, r, has a positive or negative sign. If the value of r is positive, it indicates that dependent and independent variables grow linearly or if the value of r is negative. Both the dependent and independent variables are inversely proportional to each other. Cross-correlation analysis is conducted only on the sets of features that were identified by implemented ULR and t-test analysis. If the relevant sets of features show a higher value of correlation (i.e.,r-value \(\ge\) 0.7 or r-value \(\le -0.7\)) with pertinent other sets of features, then the performance of these sets of feature separately and on the joint basis for malware detection is validated and consider those sets of feature which perform well. Figure 12 demonstrates the selected sets of the feature after implementing cross-correlation analysis. The selected sets of features are represented by utilizing a black circle \((\cdot)\), demonstrating that equivalent sets of features are considered for this research paper.

Correlation between set of features (here LT stands for lower triangle and UT stands for Upper triangle.
Stepwise forward selection for multivariate linear regression
After using cross-correlation analysis, the selected subset of features may or may not be important for creating the malware detection model. Further, a multivariate linear regression stepwise forward selection method is implemented in this study to discover the most important features for creating Android malware detection models. After applying multivariate linear regression stepwise on the retrieved feature data set, Fig. 13 shows a significant set of features. A set of features that were taken into account in this paper while building a malware detection model is represented by a black circle with the symbol \((\cdot )\).

Features selected after implementing cross correlation analysis.

Features selected after implementing multivariate linear regression stepwise forward selection.

Selected sets of feature for malware detection.
Results of testing data by considering performance parameters.
The overall outcome of the feature selection method
In this study, four distinct phases are used to identify relevant sets of features that will be taken into account while constructing the Android malware detection model. Some relevant sets of features are identified from the available sets of features in each stage based on the outcomes of the intermediate analysis. A selection of features from each of the thirty various categories of Android apps are shown in Fig. 14. To make things easier, the selected feature sets are represented by four separate characters, as shown below:
-
Empty circle symbol: Features are relevant after implementing t-test analysis.
-
Triangle symbol: Features are relevant after implementing ULR analysis and t-test.
-
Diamond symbol: Features are relevant after applied cross-correlation analysis, ULR, and t-test.
-
Filled circle symbol: Features are relevant after implementing multivariate linear regression stepwise forward selection method, cross-correlation analysis, ULR, and t-test.
Evaluation on the basis of performance parameters
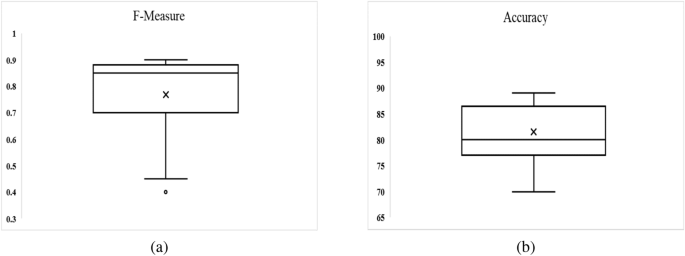
To examine set of features, a new data set is used that was not previously considered in this study. The model is originally built using ten-fold cross-validation, multivariate linear regression, and selected feature sets as input. Figure 15 illustrates the box-plot diagram for performance measures for all Android apps categories used in this study, including F-measure and Accuracy. It reveals that the outcome is computed as Accuracy of 82 percent and an average F-measure of 0.80.
Evaluation of the malware detection models developed using ANN
In this paper, we use a neural network to develop a model for malware detection using six different types of machine learning algorithms.
Two separate feature data sets are used as input to construct a model for identifying malware from Android apps (one comprises all extracted features (EF) and the other is used using the feature selection framework (SF). The following hardware was used to complete this task: a Core i7 processor with a 1 TB hard disc and 64 GB RAM. Each malware detection model’s performance is measured using two performance parameters: F-Measure and Accuracy. The outcomes of using a neural network with six different machine learning techniques to achieve performance metrics for various categories of Android apps are shown in Tables 8 and 9. From Tables 8 and 9, the following conclusions can be drawn:
-
The model developed by features selected using proposed framework (Model also developed by using distinct feature selection approaches are shown in Tables S1 to S14 in “Online Appendix A”) as an input produces better results when compared to a model constructed by taking into account all sets of features, presenting a significant value of F-measure and Accuracy for identifying malware.
-
In compared to the others, the neural network with Deep Neural Network (DNN) training method yields higher outcomes.
Figures 16 and 17 show the Accuracy and F-measure box-plot diagrams for each model built using classification methods. Each figure has two box plots, one containing all of the extracted features (EF) and the other containing only selected feature sets (SF).
The Box-plot diagram assists us in analyzing the performance of all the implemented approaches based on a single diagram. The line drawn in the middle of each box-plot diagram, i.e. the median, is used to determine its value. If a model’s median value is high, it’s regarded as the best model for detecting malware. It can be inferred from Figs. 16 and 17 that:
-
The models developed utilizing a significant set of features have high median values. The box-plot diagrams in Figs. 16 and 17 show that SF outperformed all extracted features in terms of detecting Android malware.
-
The DNN-based model yields the best results out of all the machine learning techniques for classification that have been used.

Box-plot diagram for measured performance parameter i.e., Accuracy.

Box-plot diagram for measured performance parameter i.e., F-measure.
Evaluation of the malware detection models developed using ensemble techniques
In this study, three different heterogeneous ensemble approaches are considered for creating the Android malware detection model, each with a different combination rule (1 nonlinear and two linear). From Tables 8 and 9 and Figs. 16 and 17, it can be revealed that the NDTF approach outperformed the BTE and MVE approaches. Further, it is also noticed that ensemble approaches detect more malware as compared to other implemented machine learning algorithms except DNN.
Comparison of the findings
In this study, paired Wilcoxon signed-rank tests to assess the relative performance of several feature sets and machine learning methods is employed. The Wilcoxon test with Bonferroni correction is used in this work for comparative review.
On the basis of detection approaches
To create a model that can determine whether an Android app is benign or malicious, nine different classification algorithms were evaluated. Two sets of features have been identified as inputs for developing malware detection models for thirty different categories of Android apps using two different performance parameters, namely F-Measure and Accuracy. One set of features takes into account all extracted features, and the other sets of selected features that are gained by implementing the framework of the feature selection method. Two sets of data are used for each strategy, each having 60 data points ((1 feature selection approach + 1 considering all retrieved features) * 30 Android app categories). The comparisons of pair-wise different machine learning techniques are shown in Table 10.
There are two sections in Table 10. The value of the significant difference between different pairings is shown in the second half of the table, and the calculated P value is shown in the first half. Using Bonferroni correction sets, the significant cutoff value is calculated. In this work, nine different machine learning algorithms were examined for creating malware detection models, resulting in a total of 36 potential pairs \({}^{9 techniques} C_2=36\), with all results examined at a significance threshold of 0.05. We can rule out the null hypothesis if the P value is < 0.05/36 = 0.0013. According to the study, the null hypothesis for the test implies that no significant difference exists between the two procedures. Table 10a shows that the P value is < 0.0013, indicating that there is a significant difference between the applied processes; out of 36 pairs of training techniques, 22 are offered as a significant outcome. By examining the mean difference value in Table 10a, it can be seen that the DNN method outperformed the performance of other machine learning techniques. In addition, the value of the mean difference of ensemble techniques is better when compared to other models, with the exception of the model built using DNN.
On the basis of all selected sets of feature using proposed framework and extracted features
By taking into consideration each set of features, a total of 270 different data points ((3 ensemble techniques + neural network with six machine learning techniques) * 30 types of Android apps) are developed in this study (one for each performance measure). Wilcoxon signed-rank test performance was described in Table 10b. It is seen from Table 10b that there is a significant difference between the models developed because the P value is less than 0.05. Additionally, it is evident that the features taken into account employing the feature selection framework outperformed the model developed by using all extracted feature sets when comparing the mean difference values from Table 10b to it.

Measured performance parameters i.e., Accuracy and F-measure.
Proposed framework evaluation
Results comparison with previously employed classifiers
In the present study, our newly developed malware detection model is also compared to the models developed using previously used classifiers such as decision tree analysis (DT), support vector machine (SVM), Naïve Bayes classifier (NBC), and logistic regression (LOGR). Two different sets of features (1 considering selected feature sets + 1 using all extracted features) are considered for 30 different categories of Android apps using two independent performance measures i.e., F-Measure and Accuracy. An aggregate of two sets i.e., 60 data points are employed for each classifier model are produced ((1 selected feature sets + 1 considering all extracted features)* 30 data sets). Figure 18 illustrates both the classifiers employed in this study and the most frequently used classifiers in the literature.
On the basis of Fig. 18, it can be seen that the model produced using neural networks has a higher median value and achieves better results than the model developed using the literature’s used classifiers. Further, to decide that, which model produces better results, a pairwise Wilcoxon signed rank test is implemented. Table 11 summarizes the results of the Wilcoxon test with Bonferroni correction examination for accuracy outcomes. Further, the Table 11 is divided into two sections, the first of which indicates the P value and the second of which demonstrates the mean difference between different pairs of classifiers. We implemented thirteen different machine learning approaches in this research paper (4 previously applied classifier in the literature + 9 implemented classifier in this study); thus, an aggregate of seventy eight (78) individual pairs are possible \({}^{13techniques} C_2=78\), and all classifier outcomes are examined at the 0.05 significance level. Only those null hypotheses with an P value is less than 0.05/78 = 0.000641 are rejected in this study. Table 11 shows that there is a significant difference between different implemented classifier approaches in a number of cases when the P value is less than 0.000641, i.e., 66 out of 78 pairs of classification approaches have significant outcomes. Table 11 demonstrates that the DNN approach outperforms other machine learning classifiers in terms of mean difference value.
Using cost-benefit analysis, comparison with previously employed classifiers
A cost-benefit analysis is used to evaluate the performance of developed model. Using the following equation, the cost-benefit analysis for each feature selection strategy is calculated:
In this case, \(Based_{cost}\) is determined by the correlation between the specified features set and the class error. The following equation can be used to compute \(Based_{cost}\):
The multiple correlation coefficient between the error and the selected feature set is \(\rho _{SM.fault}\) , and the classification accuracy used to build a malware detection model using the selected feature set is \(Accuracy \ (SM)\). The proposed model has a greater accuracy and a larger \(Based_{cost}\) since it has a higher multiple correlation coefficient. After adopting feature selection procedures, NAM stands for feature sets, while NSM stands for the number of selected features. The following equation can be used to determine \(Based_{cost}\):
Instead of using the feature selection validation method, we use six other feature ranking approaches to evaluate PermDroid’s performance in this study. The naming standards used for the experiment are listed in Table 12. The most important feature selection technique, as suggested in96, is the one that achieves a better value of cost-benefit. The cost-benefit analysis of different feature selection procedures is shown in Fig. 19a,b. It is discovered that sets of features were selected after applying multivariate linear regression stepwise forward selection technique, cross-correlation analysis, ULR, and t-test to achieve a higher median Cost-benefit measure when compared to other feature selection techniques used by researchers in the literature.
In the literature academicians and researchers implemented different feature ranking and feature subset selection approaches i.e., Chi-squared test, Gain-ratio, Information-gain, Principal Component Analysis and Filtered subset evaluation. To evaluate the performance of our proposed feature selection approach, an experiment was performed by using Drebin data set and accuracy is measured and represented in Table 13. Out of implemented six different feature selection techniques our proposed feature selection approach achieved an higher accuracy when compared to others.

Calculated cost-benefit value.
Comparison of results based on the amount of time it takes to identify malware in real-world apps
In this section of the article, the performance of PermDroid is compared in terms of the time needed to identify malware in real-world apps. For this experiment, we download the data set from two different repositories Drebin (https://www.sec.cs.tu-bs.de/~danarp/drebin/download.html) and AMD (http://amd.arguslab.org/) and experimented by implementing the individual frameworks. Table 14 shows that, when compared to the individual frameworks available in the literature, our suggested technique can identify malware in less time.
Comparison of the results on the basis of detection rate with different approaches or frameworks available in the literature
Furthermore, proposed malware detection model (i.e., PermDroid) is compared to previously developed techniques or frameworks present in the literature. The names, methodology, deployment, purpose, data collection, and detection rate of proposed methodologies or frameworks are listed in Table 15. Empirical result revealed that our proposed framework produced a 3 percent greater detection rate. Experiment was performed by using Drebin data set (https://www.sec.cs.tu-bs.de/~danarp/drebin/download.html).
Comparison of results with different AV Scanners
Although PermDroid outperforms the classifiers used in the research, it should ultimately be similar to the results obtained using regular anti-virus software in the field for Android malware detection. For this study, ten different anti-virus softwares are selected from the market and used them on the data set that has been gathered in this study.
When compared to the various anti-viruses employed in the experiment, PermDroid performs significantly better. The results of the anti-virus scanner study are shown in Table 16. The anti-virus scanners’ rates of virus detection vary widely. While the most effective scanners catch 97.1 percent of malware, some scanners only catch 82 percent of hazardous samples, which is probably a result of their inexperience with Android malware. PermDroid with DNN and NDTF outperform 1 out of 10 anti-virus scanners on the complete data set, with detection rates of 98.8% and 98.8%, respectively. Out of implemented different anti-virus scanners, it is discovered that at least two of them are capable of identifying every malware sample used in this study. As a result, it may conclude that PermDroid is more effective than many anti-virus scanners’ manually built signatures.
Identification of both well-known and new malware families
Detection of well-known malware families An experiment is also performed to identify whether or not our suggested framework, i.e., PermDroid, is capable of detecting malware from well-known families. The experiment is carried out on a sample of 20 families from each family (in our research paper, we collect 141 different malware families). According to empirical results, the suggested framework with DNN is capable of detecting an average of 98.8% of malware-infected apps, and the proposed framework with NDTF is likewise capable of doing the same. Table 17 lists the family names and the number of samples for each family, and Fig. 20a,b show PermDroid’s detection performance for each family (Detection rates for some families are lower because of fewer samples in the data set).

Detection rate of PermDroid with DNN and NDTF.
Detection of new malware families To examine if the suggested framework, is capable of identifying unknown malware families, PermDroid is trained with a random sample of 10 distinct families based on counting and then test is performed on the remaining families. Table 18 shows the outcomes in which PermDroid is trained with limited malware samples, which is required to generalize the characteristics of most malware families, and achieved a higher detection rate.
Experimental outcomes
The conclusions reached after conducting experimental work are presented in this section of the paper. The empirical work was done using a neural network and six different machine learning techniques, including GDA, NM, GD, GDM, LM, and DNN, as well as three ensemble approaches. The developed models outperform previously used classifiers in the literature (Table 11) and can detect malware from both known and unknown families (Table 18, Fig. 20). Additionally, they increase the rate of detection by different Antivirus scanners (stated in Table 15). It is clear from Fig. 20 and Tables 14, 15, 16, and 18 that:
-
PermDroid can detect 98.8% of Android malware, which is impossible for most AV scanners on the market.
-
With a detection rate of 98.8% for both known and unknown malware types, PermDroid is capable of finding malware.
The proposed framework is able to answer the research questions mentioned in “Research questions” section:
-
1.
To verify the importance of the correlation between the feature sets and the malware detection model, the t-test and ULR analysis are used. It is discovered that there are several separate sets of features that are highly connected with the creation of malware detection models as a result of this research.
-
2.
From Fig. 11, it can be noticed that certain sets of features pass a high correlation with other sets of features (i.e., the case with a black square is having high negative correlation, and the case with a black circle is having a high positive correlation). It is essential to remove the collinearity among the features, for calculating the ability of each feature. In this manner, the models developed by selecting sets of the feature are capable to detect malware and do not suffer from the aspect of collinearity.
-
3.
Forward stepwise selection process, ULR, correlation analysis, and t-test analysis are implemented to select features that are able to identify whether the app is malicious or not. The model built by applying the specified sets of features produces better outcomes when compared to the rest, according to t-test analysis.
-
4.
Six various types of machine learning techniques based on neural network principles, such as NM, GD, LM, GDM, GDA, and DNN, as well as three ensemble approaches, are implemented in detecting whether an app is benign or malicious. From the Tables 8 and 9, it is apparent that the model developed using an ANN and the Deep Neural Network (DNN) approach produces the best results when compared to other techniques.
-
5.
Tables 8 and 9 and Figs. 18, 19 and 20 show that our suggested model is effective in identifying malware from real-world apps when API calls, permissions, app rating, and the number of people that have downloaded the app are all considered features.
Threats to validity
In this section, threats to validity are discussed that are experienced while performing the experiment. Three different threats are mentioned below:
-
i.
Construct validity The Android malware detection methodology in this research study is capable of detecting whether an app is benign or malicious, however it does not specify how many features are needed to find vulnerabilities in Android apps.
-
ii.
Internal validity The homogeneity of the data set employed in this research work is the second threat. Apps are collected from a variety of promised repositories. Any errors made while gathering data from these sources are not taken into account in this study. Although, it cannot promise that the data collected and retrieved for our analysis is 100 percent accurate, it can be believed that it assembled consistently.
-
iii.
External validity To train the Android malware detection algorithm, 141 different malware families are considered. Furthermore, the research can be extended to include other malware families in order to train the technique to identify malicious apps.
Conclusion and future work
This study suggests a framework for selecting small set of features that helps in detecting malware from Android apps. The following are our observations based on the basis of our proposed framework in this research paper:
-
Based on the feature selection method, it is discovered that there is a limited group of attributes that can detect malware or benign apps with greater accuracy and lower values of incorrectly classified errors.
-
Using our feature selection method sets S25, S28, S19, S14, S9, and S4 of features were discovered to be important malware detectors.
-
Based on the Wilcoxon signed-rank test, it is found that there is a significant difference between all extracted features and the selected feature sets. It is found that, after calculating the mean difference that the model developed with the input of the selected feature sets outperformed the model with the input of all extracted feature sets.
-
Different classification algorithms differ significantly, according to the Wilcoxon signed-rank test. By calculating the mean difference value, it is discovered that the model created by combining a neural network with the Deep-Learning machine-learning algorithm produced superior results than the other machine learning methods used in this study.
-
It may be inferred from the results of the experiments that the NDTF approach performed better than other ensemble methods.
-
Our used classifier outperformed the performance of the classifiers used in the literature, as shown in Fig. 20 and Tables 11 and 14.
-
According to the results of the experiments (Tables 8, 9), the malware detection model built was not significantly harmed after deleting 60% of the possible number of sets of features; in fact, in almost all cases, the results were better.
-
As shown in Table 18 and Fig. 20, our proposed malware detection system can detect malware from both known and undiscovered malware families.
This study established that a malware detection method merely identifies whether an app is malicious or benign. Several avenues can be explored for future research. Firstly, a large amount of Android apps are required to develop the model, memorize and disclose information related to the data set. Second, it is also difficult to make a centralized system at the time of training and testing the model. Third, decentralized, privacy-preserving classifier model will be proposed for detecting Android malwares. Further, it is also be discovered how many permissions are necessary to evaluate whether an app is dangerous or not, more investigation may be done.
Data availibility
For materials should be addressed to corresponding authors.
References
Faruki, P. et al. Android security: A survey of issues, malware penetration, and defenses. IEEE Commun. Surv. Tutor. 17(2), 998–1022 (2014).
Gao, H., Cheng, S. & Zhang, W. Gdroid: Android malware detection and classification with graph convolutional network. Comput. Secur. 106, 102264 (2021).
Mahindru, A. & Sangal, A. MLDroid—framework for android malware detection using machine learning techniques. Neural Comput. Appl. 33, 1–58 (2020).
Fereidooni, H., Conti, M., Yao, D. & Sperduti, A. Anastasia: Android malware detection using static analysis of applications. In 2016 8th IFIP International Conference on New Technologies, Mobility and Security (NTMS), 1–5 (IEEE, 2016).
Arp, D. et al. Drebin: Effective and explainable detection of android malware in your pocket. Ndss 14, 23–26 (2014).
Yuan, Z., Lu, Y. & Xue, Y. Droiddetector: Android malware characterization and detection using deep learning. Tsinghua Sci. Technol. 21(1), 114–123 (2016).
Zhu, H. J. et al. Droiddet: Effective and robust detection of android malware using static analysis along with rotation forest model. Neurocomputing 272, 638–646 (2018).
Wong, M. Y. & Lie, D. Intellidroid: A targeted input generator for the dynamic analysis of android malware. NDSS 16, 21–24 (2016).
Dash, S. K., Suarez-Tangil, G., Khan, S., Tam, K., Ahmadi, M., Kinder, J. & Cavallaro, L. Droidscribe: Classifying android malware based on runtime behavior. In: 2016 IEEE Security and Privacy Workshops (SPW), 252–261 (IEEE, 2016).
Chen, S., Xue, M., Tang, Z., Xu, L. & Zhu, H. Stormdroid: A streaminglized machine learning-based system for detecting android malware. In Proceedings of the 11th ACM on Asia Conference on Computer and Communications Security, 377–388 (2016).
Mariconti, E., Onwuzurike, L., Andriotis, P., Cristofaro, E. D., Ross, G. & Stringhini, G. Mamadroid: Detecting Android Malware by Building Markov Chains of Behavioral Models. arXiv:1612.04433 (2016)
Kabakus, A. T. DroidMalwareDetector: A novel android malware detection framework based on convolutional neural network. Expert Syst. Appl. 206, 117833 (2022).
Mahindru, A. & Sangal, A. Deepdroid: Feature selection approach to detect android malware using deep learning. In: 2019 IEEE 10th International Conference on Software Engineering and Service Science (ICSESS), 16–19 (IEEE, 2019).
Mahindru, A. & Sangal, A. Feature-based semi-supervised learning to detect malware from android. In Automated Software Engineering: A Deep Learning-Based Approach, 93–118 (Springer, 2020).
Mahindru, A. & Sangal, A. Perbdroid: Effective malware detection model developed using machine learning classification techniques. In A Journey Towards Bio-inspired Techniques in Software Engineering 103–139 (Springer, 2020).
Mahindru, A. & Sangal, A. Hybridroid: An empirical analysis on effective malware detection model developed using ensemble methods. J. Supercomput. 77(8), 8209–8251 (2021).
Mahindru, A. & Sangal, A. Semidroid: A behavioral malware detector based on unsupervised machine learning techniques using feature selection approaches. Int. J. Mach. Learn. Cybern. 12(5), 1369–1411 (2021).
Zhao, Y. et al. On the impact of sample duplication in machine-learning-based android malware detection. ACM Trans. Softw. Eng. Methodol. (TOSEM) 30(3), 1–38 (2021).
Yumlembam, R., Issac, B., Jacob, S. M. & Yang L. IoT-based android malware detection using graph neural network with adversarial defense. IEEE Internet Things J. (2022).
Kumar, L., Misra, S. & Rath, S. K. An empirical analysis of the effectiveness of software metrics and fault prediction model for identifying faulty classes. Comput. Stand. Interfaces 53, 1–32 (2017).
Faruki, P., Ganmoor, V., Laxmi, V., Gaur, M. S. & Bharmal, A. Androsimilar: Robust statistical feature signature for android malware detection. In Proceedings of the 6th International Conference on Security of Information and Networks, 152–159 (2013).
Milosevic, J., Malek, M. & Ferrante, A. Time, accuracy and power consumption tradeoff in mobile malware detection systems. Comput. Secur. 82, 314–328 (2019).
Shabtai, A., Kanonov, U., Elovici, Y., Glezer, C. & Weiss, Y. Andromaly: A behavioral malware detection framework for android devices. J. Intell. Inf. Syst. 38(1), 161–190 (2012).
Badhani, S. & Muttoo, S. K. Android malware detection using code graphs. In System Performance and Management Analytics, 203–215 (Springer, 2019).
Xu, R., Saïdi, H. & Anderson, R. Aurasium: Practical policy enforcement for android applications. In Presented as part of the 21st\(\{\)USENIX\(\}\)Security Symposium (\(\{\)USENIX\(\}\)Security 12), 539–552 (2012).
Lindorfer, M., Neugschwandtner, M., Weichselbaum, L., Fratantonio, Y., Veen, V. V. D. & Platzer, C. (2014) Andrubis–1,000,000 apps later: A view on current android malware behaviors. In 2014 Third International Workshop on Building Analysis Datasets and Gathering Experience Returns for Security (BADGERS), 3–17 (IEEE).
Ikram, M., Beaume, P. & Kâafar, M. A. Dadidroid: An Obfuscation Resilient Tool for Detecting Android Malware via Weighted Directed Call Graph Modelling. arXiv:1905.09136 (2019).
Shen, F., Vecchio, J. D., Mohaisen, A., Ko, S. Y. & Ziarek, L. Android malware detection using complex-flows. IEEE Trans. Mob. Comput. 18(6), 1231–1245 (2018).
Yang, W., Prasad, M. R. & Xie, T. Enmobile: Entity-based characterization and analysis of mobile malware. In Proceedings of the 40th International Conference on Software Engineering, 384–394 (2018).
Enck, W. et al. Taintdroid: an information-flow tracking system for realtime privacy monitoring on smartphones. ACM Trans. Comput. Syst. (TOCS) 32(2), 1–29 (2014).
Portokalidis, G., Homburg, P., Anagnostakis, K. & Bos, H. (2010) Paranoid android: Versatile protection for smartphones. In Proceedings of the 26th Annual Computer Security Applications Conference, 347–356.
Bläsing, T., Batyuk, L., Schmidt, A. D., Camtepe, S. A. & Albayrak, S. An android application sandbox system for suspicious software detection. In 2010 5th International Conference on Malicious and Unwanted Software, 55–62 (IEEE, 2010).
Aubery-Derrick, S. Detection of Smart Phone Malware. Unpublished Ph.D. Thesis, 1–211 (Electronic and Information Technology University, Berlin, 2011).
Burguera, I., Zurutuza, U. & Nadjm-Tehrani, S. Crowdroid: Behavior-based malware detection system for android. In Proceedings of the 1st ACM Workshop on Security and Privacy in Smartphones and Mobile Devices, 15–26 (2011).
Grace, M. C., Zhou, Y., Wang, Z. & Jiang, X. Systematic detection of capability leaks in stock android smartphones. In NDSS, vol 14, 19 (2012).
Grace, M., Zhou, Y., Zhang, Q., Zou, S. & Jiang, X. Riskranker: Scalable and accurate zero-day android malware detection. In Proceedings of the 10th International Conference on Mobile Systems, Applications, and Services, 281–294 (2012).
Zheng, C., Zhu, S., Dai, S., Gu, G., Gong, X., Han, X. & Zou, W. Smartdroid: An automatic system for revealing UI-based trigger conditions in android applications. In Proceedings of the Second ACM Workshop on Security and Privacy in Smartphones and Mobile Devices, 93–104 (2012).
Dini, G., Martinelli, F., Saracino, A. & Sgandurra, D. Madam: A multi-level anomaly detector for android malware. In International Conference on Mathematical Methods, Models, and Architectures for Computer Network Security, 240–253 (Springer, 2012).
Yan, L. K. & Yin, H. Droidscope: Seamlessly reconstructing the \(\{\)OS\(\}\) and Dalvik semantic views for dynamic android malware analysis. In Presented as part of the 21st\(\{\)USENIX\(\}\)Security Symposium (\(\{\)USENIX\(\}\)Security 12), 569–584 (2012).
Backes, M., Gerling, S., Hammer, C., Maffei, M. & von Styp-Rekowsky, P. Appguard–enforcing user requirements on android apps. In International Conference on TOOLS and Algorithms for the Construction and Analysis of Systems, 543–548 (Springer, 2013).
Shahzad, F., Akbar, M., Khan, S. & Farooq, M. Tstructdroid: Realtime malware detection using in-execution dynamic analysis of kernel process control blocks on android. Tech Rep (National University of Computer and Emerging Sciences, Islamabad, 2013).
Rastogi, V., Chen, Y. & Enck, W. Appsplayground: Automatic security analysis of smartphone applications. In Proceedings of the third ACM Conference on Data and Application Security and Privacy, 209–220 (2013).
Rosen, S., Qian, Z. & Mao, Z. M. Appprofiler: A flexible method of exposing privacy-related behavior in android applications to end users. In Proceedings of the Third ACM Conference on Data and Application Security and Privacy, 221–232 (2013).
Desnos, A. et al. Androguard-reverse engineering, malware and goodware analysis of android applications. URL code google com/p/androguard 153 (2013).
Tam, K., Khan, S. J., Fattori, A. & Cavallaro, L. Copperdroid: Automatic reconstruction of android malware behaviors. In Ndss (2015).
Suarez-Tangil, G., Dash, S. K., Ahmadi, M., Kinder, J., Giacinto, G. & Cavallaro, L. Droidsieve: Fast and accurate classification of obfuscated android malware. In Proceedings of the Seventh ACM on Conference on Data and Application Security and Privacy, 309–320 (2017).
Idrees, F., Rajarajan, M., Conti, M., Chen, T. M. & Rahulamathavan, Y. Pindroid: A novel android malware detection system using ensemble learning methods. Comput. Secur. 68, 36–46 (2017).
Martín, A., Menéndez, H. D. & Camacho, D. Mocdroid: Multi-objective evolutionary classifier for android malware detection. Soft. Comput. 21(24), 7405–7415 (2017).
Karbab, E. B., Debbabi, M., Derhab, A. & Mouheb, D. Maldozer: Automatic framework for android malware detection using deep learning. Digit. Investig. 24, S48–S59 (2018).
Lee, W. Y., Saxe, J. & Harang, R. Seqdroid: Obfuscated android malware detection using stacked convolutional and recurrent neural networks. In Deep Learning Applications for Cyber Security, 197–210 (Springer, 2019).
Alzaylaee, M. K., Yerima, S. Y. & Sezer, S. DL-Droid: Deep learning based android malware detection using real devices. Comput. Secur. 89, 101663 (2020).
Yuan, Z., Lu, Y., Wang, Z. & Xue, Y. Droid-sec: Deep learning in android malware detection. In Proceedings of the 2014 ACM Conference on SIGCOMM, 371–372 (2014).
Zhang, M., Duan, Y., Yin, H. & Zhao, Z. Semantics-aware android malware classification using weighted contextual API dependency graphs. In Proceedings of the 2014 ACM SIGSAC Conference on Computer and Communications Security, 1105–1116 (2014).
Shankar, V. G., Somani, G., Gaur, M. S., Laxmi, V. & Conti, M. Androtaint: An efficient android malware detection framework using dynamic taint analysis. In 2017 ISEA Asia Security and Privacy (ISEASP), 1–13 (IEEE, 2017).
Mahindru, A. & Singh, P. Dynamic permissions based android malware detection using machine learning techniques. In Proceedings of the 10th Innovations in Software Engineering Conference, 202–210 (2017).
Shi, B. et al. Prediction of recurrent spontaneous abortion using evolutionary machine learning with joint self-adaptive sime mould algorithm. Comput. Biol. Med. 148, 105885 (2022).
Zhang, Q., Wang, D. & Wang, Y. Convergence of decomposition methods for support vector machines. Neurocomputing 317, 179–187 (2018).
Hou, S., Saas, A., Chen, L. & Ye, Y. Deep4maldroid: A deep learning framework for android malware detection based on linux kernel system call graphs. In 2016 IEEE/WIC/ACM International Conference on Web Intelligence Workshops (WIW), 104–111 (IEEE, 2016).
Nix, R. & Zhang, J. Classification of android apps and malware using deep neural networks. In 2017 International Joint Conference on Neural Networks (IJCNN), 1871–1878 (IEEE, 2017).
Zhang, X. A deep learning based framework for detecting and visualizing online malicious advertisement. Ph.D. Thesis, University of New Brunswick (2018)
Nauman, M., Tanveer, T. A., Khan, S. & Syed, T. A. Deep neural architectures for large scale android malware analysis. Clust. Comput. 21(1), 569–588 (2018).
Xiao, X., Wang, Z., Li, Q., Xia, S. & Jiang, Y. Back-propagation neural network on Markov chains from system call sequences: a new approach for detecting android malware with system call sequences. IET Inf. Secur. 11(1), 8–15 (2016).
Martinelli, F., Marulli, F. & Mercaldo, F. Evaluating convolutional neural network for effective mobile malware detection. Procedia Comput. Sci. 112, 2372–2381 (2017).
Xiao, X., Zhang, S., Mercaldo, F., Hu, G. & Sangaiah, A. K. Android malware detection based on system call sequences and LSTM. Multim. Tools Appl. 78(4), 3979–3999 (2019).
Dimjašević, M., Atzeni, S., Ugrina, I. & Rakamaric, Z. Evaluation of android malware detection based on system calls. In Proceedings of the 2016 ACM on International Workshop on Security and Privacy Analytics, 1–8 (2016).
Mas’ud, M. Z., Sahib, S., Abdollah, M. F., Selamat, S. R. & Yusof, R. Analysis of features selection and machine learning classifier in android malware detection. In 2014 International Conference on Information Science and Applications (ICISA), 1–5 (IEEE, 2014).
Yerima, S. Y., Sezer, S., McWilliams, G. & Muttik, I. A new android malware detection approach using Bayesian classification. In 2013 IEEE 27th International Conference on Advanced Information Networking and Applications (AINA), 121–128 (IEEE, 2013).
Narudin, F. A., Feizollah, A., Anuar, N. B. & Gani, A. Evaluation of machine learning classifiers for mobile malware detection. Soft. Comput. 20(1), 343–357 (2016).
Wang, W. et al. Exploring permission-induced risk in android applications for malicious application detection. IEEE Trans. Inf. Forensics Secur. 9(11), 1869–1882 (2014).
Ayar, M., Isazadeh, A., Gharehchopogh, F. S. & Seyedi, M. NSICA: Multi-objective imperialist competitive algorithm for feature selection in arrhythmia diagnosis. Comput. Biol. Med. 161, 107025 (2023).
Hu, H. et al. Dynamic individual selection and crossover boosted forensic-based investigation algorithm for global optimization and feature selection. J. Bionic Eng. 20, 1–27 (2023).
Zhong, C., Li, G., Meng, Z., Li, H. & He, W. A self-adaptive quantum equilibrium optimizer with artificial bee colony for feature selection. Comput. Biol. Med. 153, 106520 (2023).
Zhou, P. et al. Unsupervised feature selection for balanced clustering. Knowl.-Based Syst. 193, 105417 (2020).
Allix, K. et al. Empirical assessment of machine learning-based malware detectors for android. Empir. Softw. Eng. 21(1), 183–211 (2016).
Narayanan, A., Chandramohan, M., Chen, L. & Liu, Y. A multi-view context-aware approach to android malware detection and malicious code localization. Empir. Softw. Eng. 23(3), 1222–1274 (2018).
Azmoodeh, A., Dehghantanha, A. & Choo, K. K. R. Robust malware detection for internet of (battlefield) things devices using deep eigenspace learning. IEEE Trans. Sustain. Comput. 4(1), 88–95 (2018).
Chen, K. Z., Johnson, N. M., D’Silva, V., Dai, S., MacNamara, K., Magrino, T. R., Wu, E. X., Rinard, M. & Song, D. X. Contextual policy enforcement in android applications with permission event graphs. In: NDSS, 234 (2013).
Yerima, S. Y., Sezer, S. & McWilliams, G. Analysis of Bayesian classification-based approaches for android malware detection. IET Inf. Secur. 8(1), 25–36 (2014).
Gonzalez, H., Stakhanova, N. & Ghorbani, A. A. Droidkin: Lightweight detection of android apps similarity. In International Conference on Security and Privacy in Communication Networks, 436–453 (Springer, 2014) .
Kadir, A. F. A., Stakhanova, N. & Ghorbani, A. A. Android botnets: What urls are telling us. In International Conference on Network and System Security, 78–91 (Springer, 2015).
Zhou, Y. & Jiang, X. Android malware genome project. Disponibile a http://www.malgenomeproject.org (2012).
Garcia, J., Hammad, M. & Malek, S. Lightweight, obfuscation-resilient detection and family identification of android malware. ACM Trans. Softw. Eng. Methodol. (TOSEM) 26(3), 1–29 (2018).
Mahindru, A. & Sangal, A. Parudroid: Validation of android malware detection dataset. J. Cybersecur. Inform. Manag. 3(2), 42–52 (2020).
McCulloch, W. S. & Pitts, W. A logical calculus of the ideas immanent in nervous activity. Bull. Math. Biophys. 5(4), 115–133 (1943).
Faruk, M. J. H., Shahriar, H., Valero, M., Barsha, F. L., Sobhan, S., Khan, M. A., Whitman, M., Cuzzocrea, A., Lo, D., Rahman, A., et al. Malware detection and prevention using artificial intelligence techniques. In 2021 IEEE International Conference on Big Data (Big Data), 5369–5377 (IEEE, 2021).
Battiti, R. First-and second-order methods for learning: Between steepest descent and newton’s method. Neural Comput. 4(2), 141–166 (1992).
Levenberg, K. A method for the solution of certain non-linear problems in least squares. Q. Appl. Math. 2(2), 164–168 (1944).
Bengio, Y. Learning deep architectures for AI. Found. Trends® Mach. Learn.2(1), 1–127 (2009).
Kaur, J., Singh, S., Kahlon, K. S. & Bassi, P. Neural network-a novel technique for software effort estimation. Int. J. Comput. Theory Eng. 2(1), 17 (2010).
Doraisamy, S., Golzari, S., Mohd, N., Sulaiman, M. N. & Udzir, N. I. A study on feature selection and classification techniques for automatic genre classification of traditional Malay music. In ISMIR, 331–336 (2008).
Forman, G. An extensive empirical study of feature selection metrics for text classification. J. Mach. Learn. Res. 3(Mar), 1289–1305 (2003).
Furlanello, C., Serafini, M., Merler, S. & Jurman, G. Entropy-based gene ranking without selection bias for the predictive classification of microarray data. BMC Bioinform. 4(1), 54 (2003).
Coronado-De-Alba, L. D., Rodríguez-Mota, A. & Escamilla-Ambrosio, P. J. Feature selection and ensemble of classifiers for android malware detection. In 2016 8th IEEE Latin-American Conference on Communications (LATINCOM), 1–6 (IEEE, 2016).
Deepa, K., Radhamani, G. & Vinod, P. Investigation of feature selection methods for android malware analysis. Procedia Comput. Sci. 46, 841–848 (2015).
Kothari, C. R. Research methodology: Methods and techniques. New Age International (2004).
Chaikla, N. & Qi, Y. Genetic algorithms in feature selection. In IEEE SMC’99 Conference Proceedings. 1999 IEEE International Conference on Systems, Man, and Cybernetics (Cat. No. 99CH37028), vol 5, 538–540 (IEEE, 1999).
Onwuzurike, L. et al. Mamadroid: Detecting android malware by building Markov chains of behavioral models (extended version). ACM Trans. Privacy Secur. (TOPS) 22(2), 1–34 (2019).
Hou, S., Ye, Y., Song, Y. & Abdulhayoglu, M. Hindroid: An intelligent android malware detection system based on structured heterogeneous information network. In Proceedings of the 23rd ACM SIGKDD International Conference on Knowledge Discovery and Data Mining, 1507–1515 (2017) .
Zhu, H. J. et al. HEMD: A highly efficient random forest-based malware detection framework for android. Neural Comput. Appl. 30(11), 3353–3361 (2018).
Wang, W., Zhao, M. & Wang, J. Effective android malware detection with a hybrid model based on deep autoencoder and convolutional neural network. J. Ambient. Intell. Humaniz. Comput. 10(8), 3035–3043 (2019).
Han, W., Xue, J., Wang, Y., Liu, Z. & Kong, Z. Malinsight: A systematic profiling based malware detection framework. J. Netw. Comput. Appl. 125, 236–250 (2019).
Zou, D. et al. Intdroid: Android malware detection based on API intimacy analysis. ACM Trans. Softw. Eng. Methodol. (TOSEM) 30(3), 1–32 (2021).
Mahindru, A. & Arora, H. Dnndroid: Android malware detection framework based on federated learning and edge computing. In International Conference on Advancements in Smart Computing and Information Security, 96–107 (Springer, 2022).
Mahindru, A. & Arora, H. Parudroid: Framework that enhances smartphone security using an ensemble learning approach. SN Comput. Sci. 4(5), 630 (2023).
Mahindru, A., Sharma, S. K. & Mittal, M. Yarowskydroid: Semi-supervised based android malware detection using federation learning. In 2023 International Conference on Advancement in Computation & Computer Technologies (InCACCT), 380–385 (IEEE, 2023).
Acknowlegment
This work was partly supported by the Technology Innovation Program funded by the Ministry of Trade, Industry & Energy (MOTIE) (No.20022899) and by the Technology Development Program of MSS (No.S3033853).
Author information
Authors and Affiliations
Contributions
All the authors have contributed equally.
Corresponding authors
Ethics declarations
Competing interests
The authors declare no competing interests.
Additional information
Publisher's note
Springer Nature remains neutral with regard to jurisdictional claims in published maps and institutional affiliations.
Supplementary Information
Rights and permissions
Open Access This article is licensed under a Creative Commons Attribution 4.0 International License, which permits use, sharing, adaptation, distribution and reproduction in any medium or format, as long as you give appropriate credit to the original author(s) and the source, provide a link to the Creative Commons licence, and indicate if changes were made. The images or other third party material in this article are included in the article’s Creative Commons licence, unless indicated otherwise in a credit line to the material. If material is not included in the article’s Creative Commons licence and your intended use is not permitted by statutory regulation or exceeds the permitted use, you will need to obtain permission directly from the copyright holder. To view a copy of this licence, visit http://creativecommons.org/licenses/by/4.0/.
About this article

Cite this article
Mahindru, A., Arora, H., Kumar, A. et al. PermDroid a framework developed using proposed feature selection approach and machine learning techniques for Android malware detection. Sci Rep 14, 10724 (2024). https://doi.org/10.1038/s41598-024-60982-y
Received:
Accepted:
Published:
DOI: https://doi.org/10.1038/s41598-024-60982-y
Keywords
Comments
By submitting a comment you agree to abide by our Terms and Community Guidelines. If you find something abusive or that does not comply with our terms or guidelines please flag it as inappropriate.
